How to Design for Fatigue in Magnesium Alloys: S-N Curves, Notches, Surface Effects, and Life Validation
Explains how fatigue data for magnesium alloys are influenced by alloy composition, manufacturing process, material orientation, notches, surface condition, corrosion, and mean stress—and outlines the step-by-step process from specimen testing to component-level durability validation.
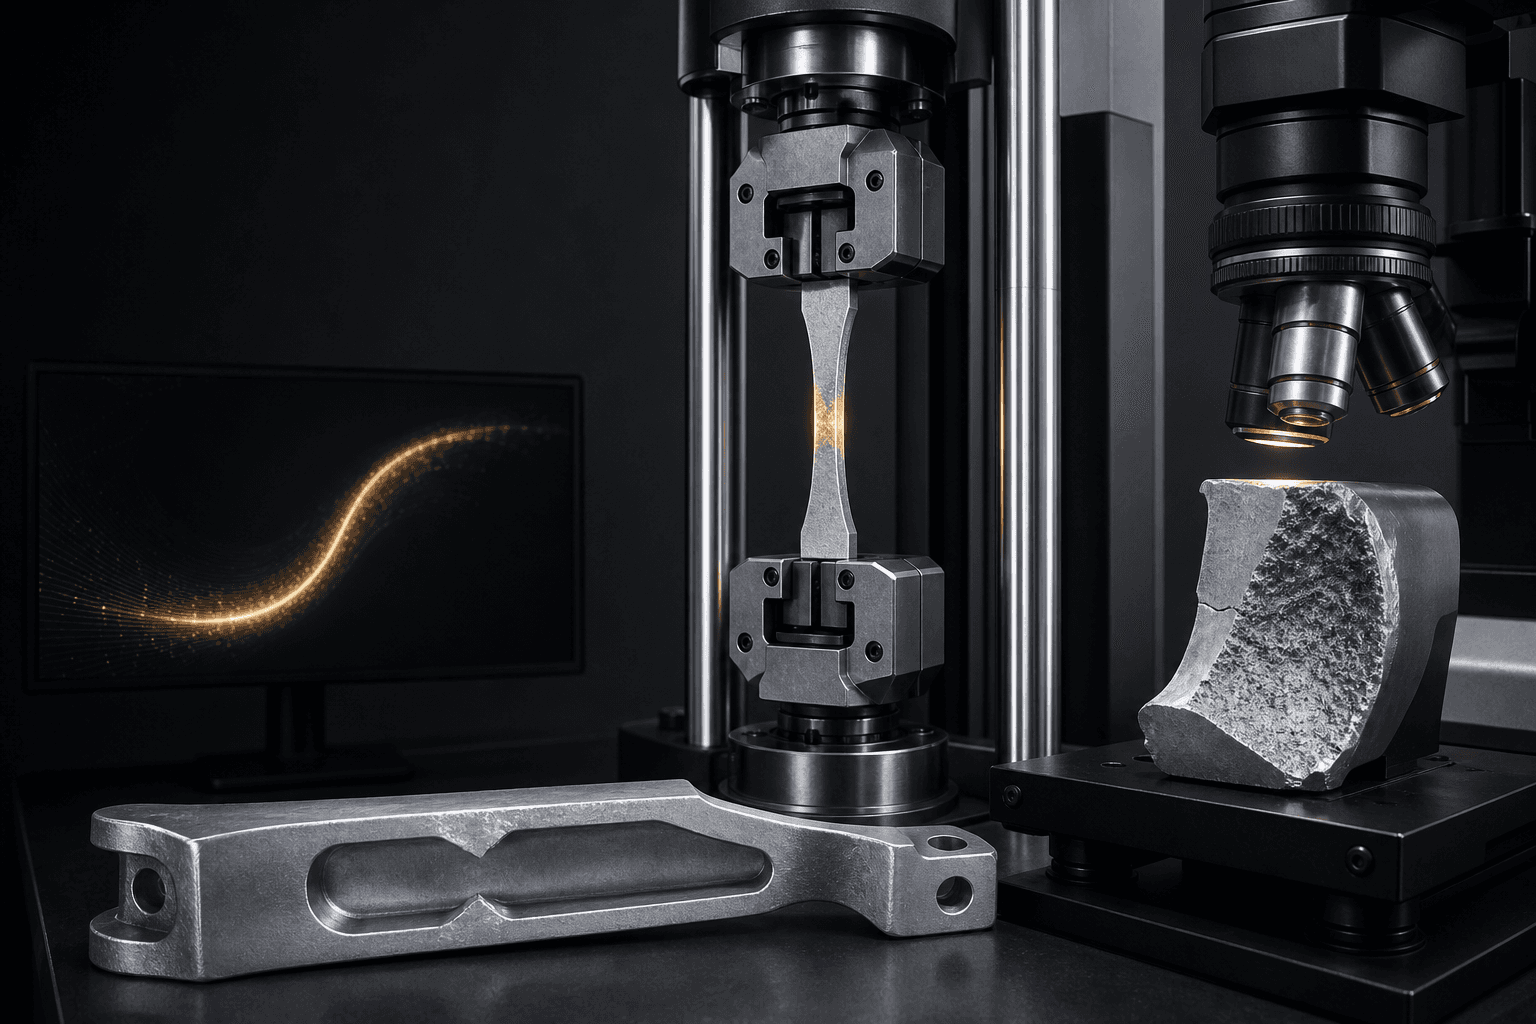
The fatigue life of magnesium-alloy components cannot be directly inferred from a single tensile strength value. Porosity in die-cast parts, flow lines in forgings, rolling direction, machining tool marks, thread roots, corrosion pitting, and mean stress all alter crack initiation locations. Fatigue design must therefore rely on fatigue data generated under conditions matching the actual manufacturing process and service environment.
First, Understand the Boundaries of S-N Data
S-N curves describe cyclic life at a given stress amplitude—but results depend on load ratio, frequency, waveform, environment, specimen surface finish, material orientation, and statistical methodology. When referencing published data, always verify the failure definition and survival probability; do not apply the mean value from polished, smooth-bar specimens as the design allowable for as-cast components.
Five Most Commonly Underestimated Factors
- Notches: Holes, fillets, threads, and rib roots amplify local stresses;
- Surface Condition: Tool marks, shot peening, pre-coating surface treatments, and scratches influence crack initiation;
- Internal Defects: Pore size, location, and depth below the surface matter more than overall porosity;
- Directionality: Rolling, extrusion, forging, and additive manufacturing can all introduce anisotropic behavior;
- Environment: Salt spray, condensation, and galvanic corrosion may turn localized pitting into fatigue crack initiation sites.
From Material Data to Component-Level Validation
Phase I compares alloys, tempers, and processes using standard material specimens; Phase II evaluates notch sensitivity using feature-rich specimens with realistic fillets, holes, and surface finishes; Phase III applies real-world load spectra to components or representative subsystems; finally, full-system durability testing—coupled with environmental exposure and post-test teardown analysis—confirms performance.
Load Spectra Better Represent Real-World Usage Than Single-Frequency Sine Waves
Road, flight, vibration, and handheld drop loads typically contain varying amplitudes, sequences, and dwell times. Load time histories should be obtained from physical testing or simulation, with clear definitions of peaks, cycle counting methods, boundary conditions, and failure criteria—especially focusing on damage accumulation after high-magnitude load events.
Preserve Evidence During Failure Analysis
Record fracture location, crack origin, pore distribution, corrosion products, and surface machining direction. If cracks consistently initiate at the same bolt stud or tool mark, optimizing geometry and surface treatment may deliver greater returns than switching alloy grades.
Procurement & Validation Checklist
- Alloy grade, temper, product form, and manufacturing process;
- Fatigue data specifications: load ratio, orientation, environmental conditions, and statistical confidence level;
- Defect limits, surface roughness requirements, and coating specifications for critical zones;
- Realistic load spectrum, fixture boundary conditions, and failure criteria;
- Re-validation requirements following batch changes, cavity updates, or process modifications;
- Fractography and full data traceability.
To develop a fatigue validation plan for lightweight structures, contact us with your load profiles and critical regions. Explore candidate materials in our Product Center.
Sources
ASTM E466 — Force Controlled Constant Amplitude Axial Fatigue Tests ASTM E739 — Statistical Analysis of Linear or Linearized Stress-Life Data